Mouse Brain data: Combine ANOVA with pattern match for regions
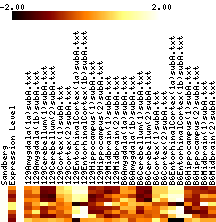
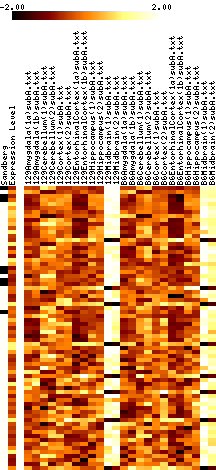
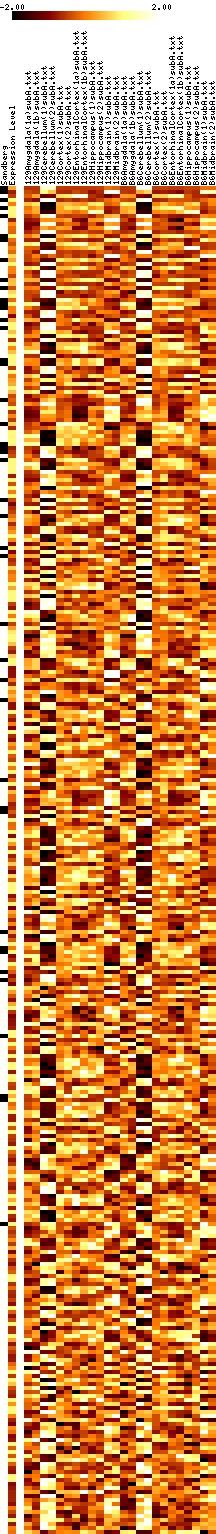
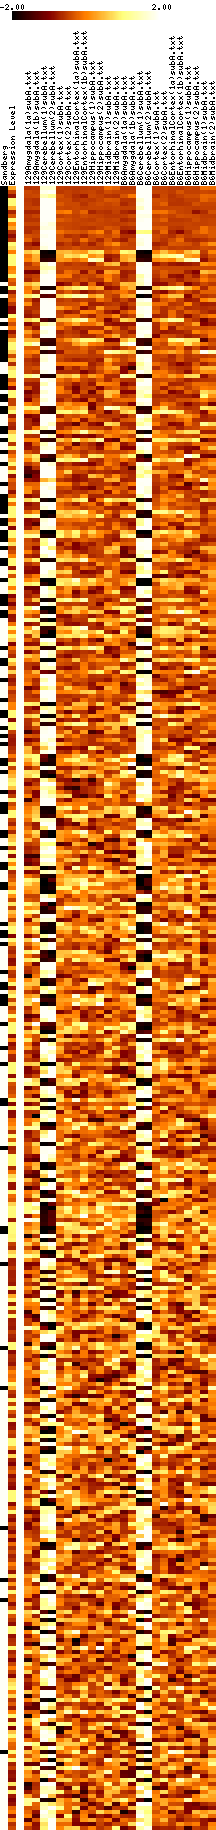
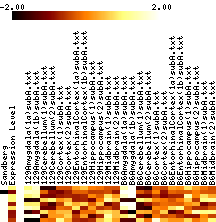
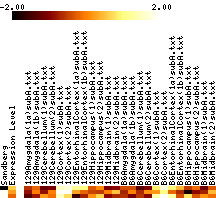
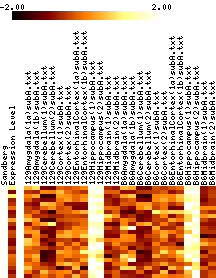
General notes applying to all analysis:
- Results images are filtered to remove genes with mostly negative expression values.
- Images show data that has been adjusted to mean zero, variance one, and clipped to increase contrast. More on reading images here.
- The image column headings refer to "subA"; this is an artifact of how we set this up, and both subA and subB arrays were used for the analysis.
- Clicking on an image will show you the detailed results for that gene.
- There are also HTML versions of the data. At this point the genes which have mostly negative values are still in those tables. A warning will be shown when you encounter one which would be filtered.
- You can access Sandberg's raw data file lines corresponding to a probe or accession number by entering it in the form; similarly you can get this from the HTML table versions of the data.
- In each figure, genes with p values <0.001 are shown. The leftmost column shows a black tick if Sandberg listed the gene; the second column is the average expression level of the gene (clipped at 1000). The rest of the columns show the data, adjusted to a mean of zero and variance of one, and clipped to the range -1 to 1 (this increases the contrast). The genes are listed in order of increasing p value.
- Annotations are not necessarily complete as given here.
Entorhinal Cortex |
Midbrain |
CxAgHpEc |
|
 |
 |
 |
|
Cerebellum |
Amygdala |
Cortex |
Hippocampus |
 |
 |
 |
 |
References
- --