Tmm: Using the web interface to the database
Go back to the query interface
The web interface provides a simple way to find coexpression links for a specific gene.
Identifiers (Dbsource and ID fields): Not all genes are represented on microarrays, so if you fail to get any results, this could be the reason. If in doubt, find and use a probe identifier for a particular microarray. Here are the different kinds of identifiers Tmm understands.
- Gene name: The most common way to search the database is using an official gene name, but other types of queries are possible. Note that our official gene names usually come from Unigene, which means they are almost always, but not quite, the official gene name. If you test a gene name and nothing comes back, you might have to try an alternative identifier.
- Unigene, Genbank or Swissprot ids: You can search by any of these identifiers. However, most Genbank ids are not represented in the database. Use Genbank as a last resort.
- Probe id: An Affymetrix probe id, or an IMAGE clone id. For IMAGE clone ids, it will only work if that identifier is used on a microarray in our database.
Stringency
Enter a small integer value here. This sets the number of data sets a link must be seen in before it is listed in the results. We recommend starting with a value of 3 for most human queries. However, if you are using a keyword that restricts the results to a smaller number of data sets, you may want to reduce this value. Try it and repeat the query with higher or lower values.
Key words
Here you can select a key word to restrict your search. The keywords are only listed if they are used in more than one data set. This feature is dependent on our meta data, which are still under development. Currently you can only use one key word at a time to limit your queries.
On chip
You only need to use this option if you are entering a probe identifier in the "Dbsource" field. This is in fact optional as our system will try to find a matching probe if you enter the wrong array. This works because probe ids are (so far) unique.
Id
Enter the identifier here (gene name, etc.).
Refseq60
Check this box to limit your query to the data and genes used in the paper. Otherwise your query will be applied to the full set of genes in our database.
Suppress visualizations
Skip presentation of the full data information. This can speed up your queries.
Results page
The results are presented in two formats: a table of genes, and a set of visualizations of the actual microarray data.
Table of results
The main results section is a table listing the genes that your query were coexpressed with, given the criteria you set. The columns of this table include:
- linked gene: The name of the gene. Usually this is an official name but in some cases will be a unigene cluster, a swissprot id, or even a genbank accession number.g
- description: The title of the gene.
- #ds: The number of data sets the link appears in.
- datasets: The names of the data sets the link appears in. The hyperlinks lead to the visualizations for each data set.
- score: The average correlation value for the gene.
- pval: The average log (base 10) p value for the link in the different data sets. These p values are multiple test corrected.
- alt ids: Links to external databases. U= unigene. S=swissprot. L=locuslink. You may see G=genbank
- numtests: How many times the link was tested in our database. This is an experimental feature and may be changed. Links that are tested only a few times have a lower chance of appearing in multiple data sets.
Getting text back out
Use the "download results" link near the top of the page to download a text file that contains the tabulated results. This file can serve as a permanent record of your query.
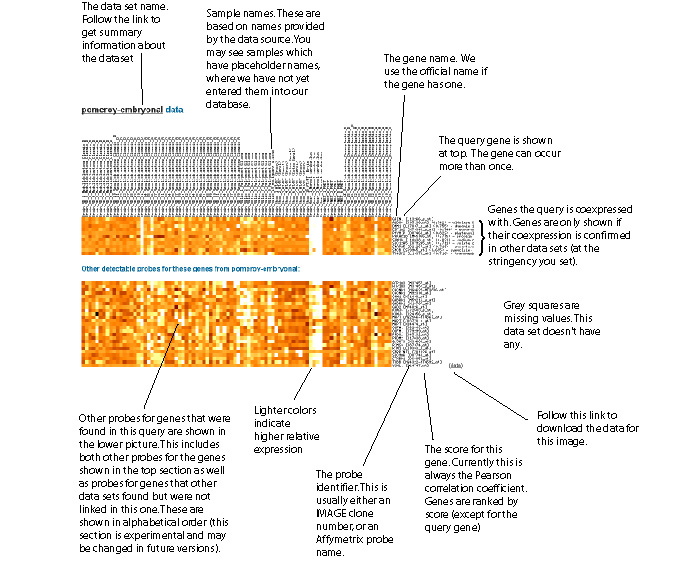
Example of data visualization
These visualizations are only shown if you uncheck "suppress visualizations" on the query form.
Light colors indicate higher expression. Grey indicates a missing value.