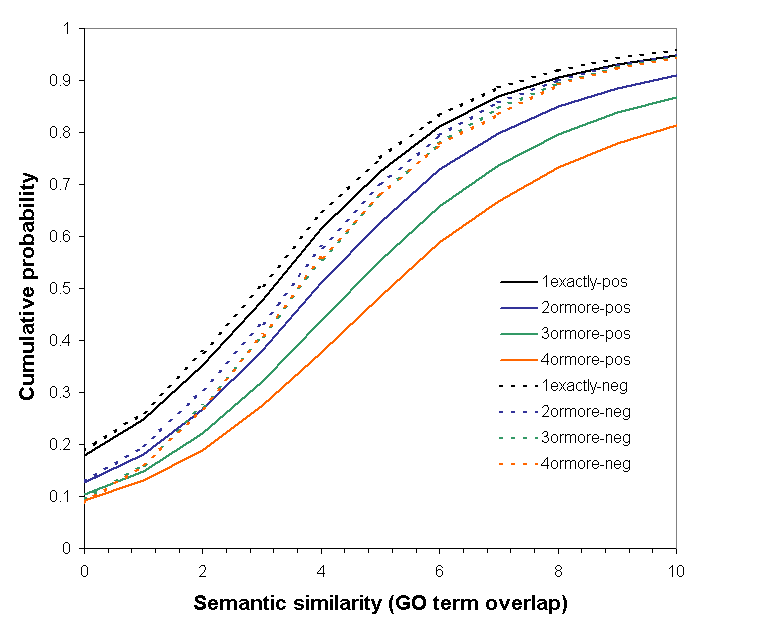
This figure is similar to Figure 4 in the paper, but shows the analysis for positive correlation links separated from negative correlation links. Though both types of links show increases in the median semantic similarity with increasing confirmation, the effect is much less pronounced for the negative correlations, and appears to show little increase beyond 3 confirmations.


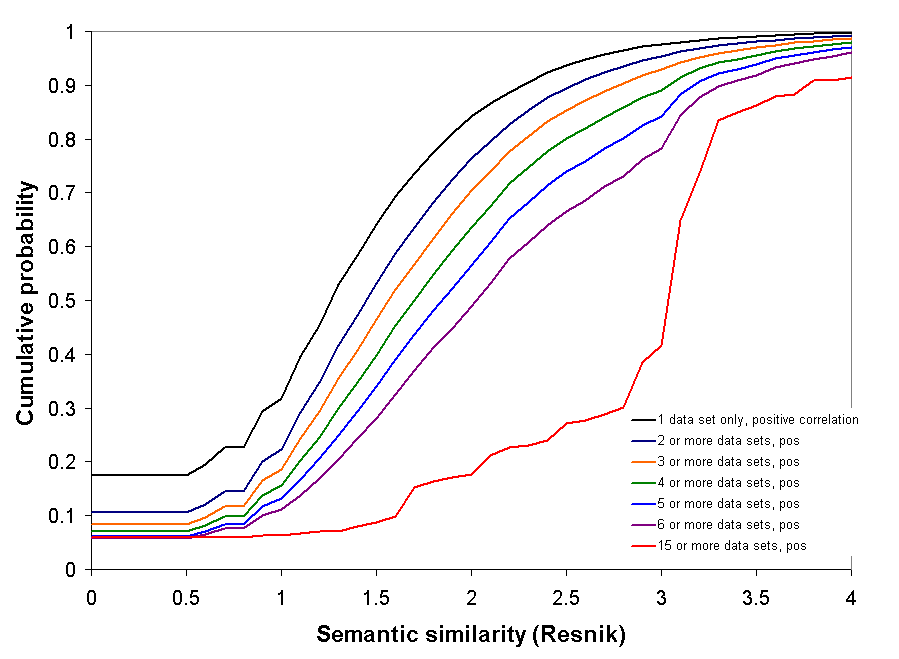
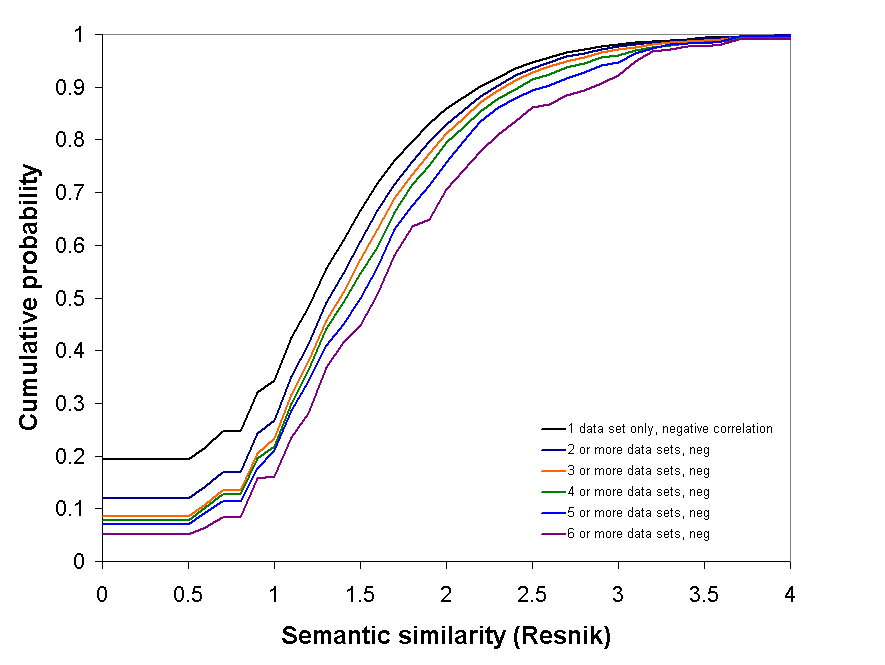
These graphs show a similar analysis to that shown in figures 4 and in supplementary figure E, but using the semantic similarity metric of Resnik (first applied to GO by Lord et al., Bioinformatics 19, p 1275 [2003]). The results are essentialy the same as for the term overlap metric, though for negative correlation links the increase in semantic simliarity looks somewhat stronger than as shown in Supplementary Figure E. In comparison to positive correlations the difference is striking.